Bakersfield History Interactive history prototype
Sixteen scenes.One city's story.Sixteenscenes. Onecity's story.
Collins Creative researched, wrote, and art-directed a 16-scene history of Bakersfield, California, from the Kern River and Native homelands to the city today, and built the content file, editor, and image pipeline that keep it accurate and easy to change.
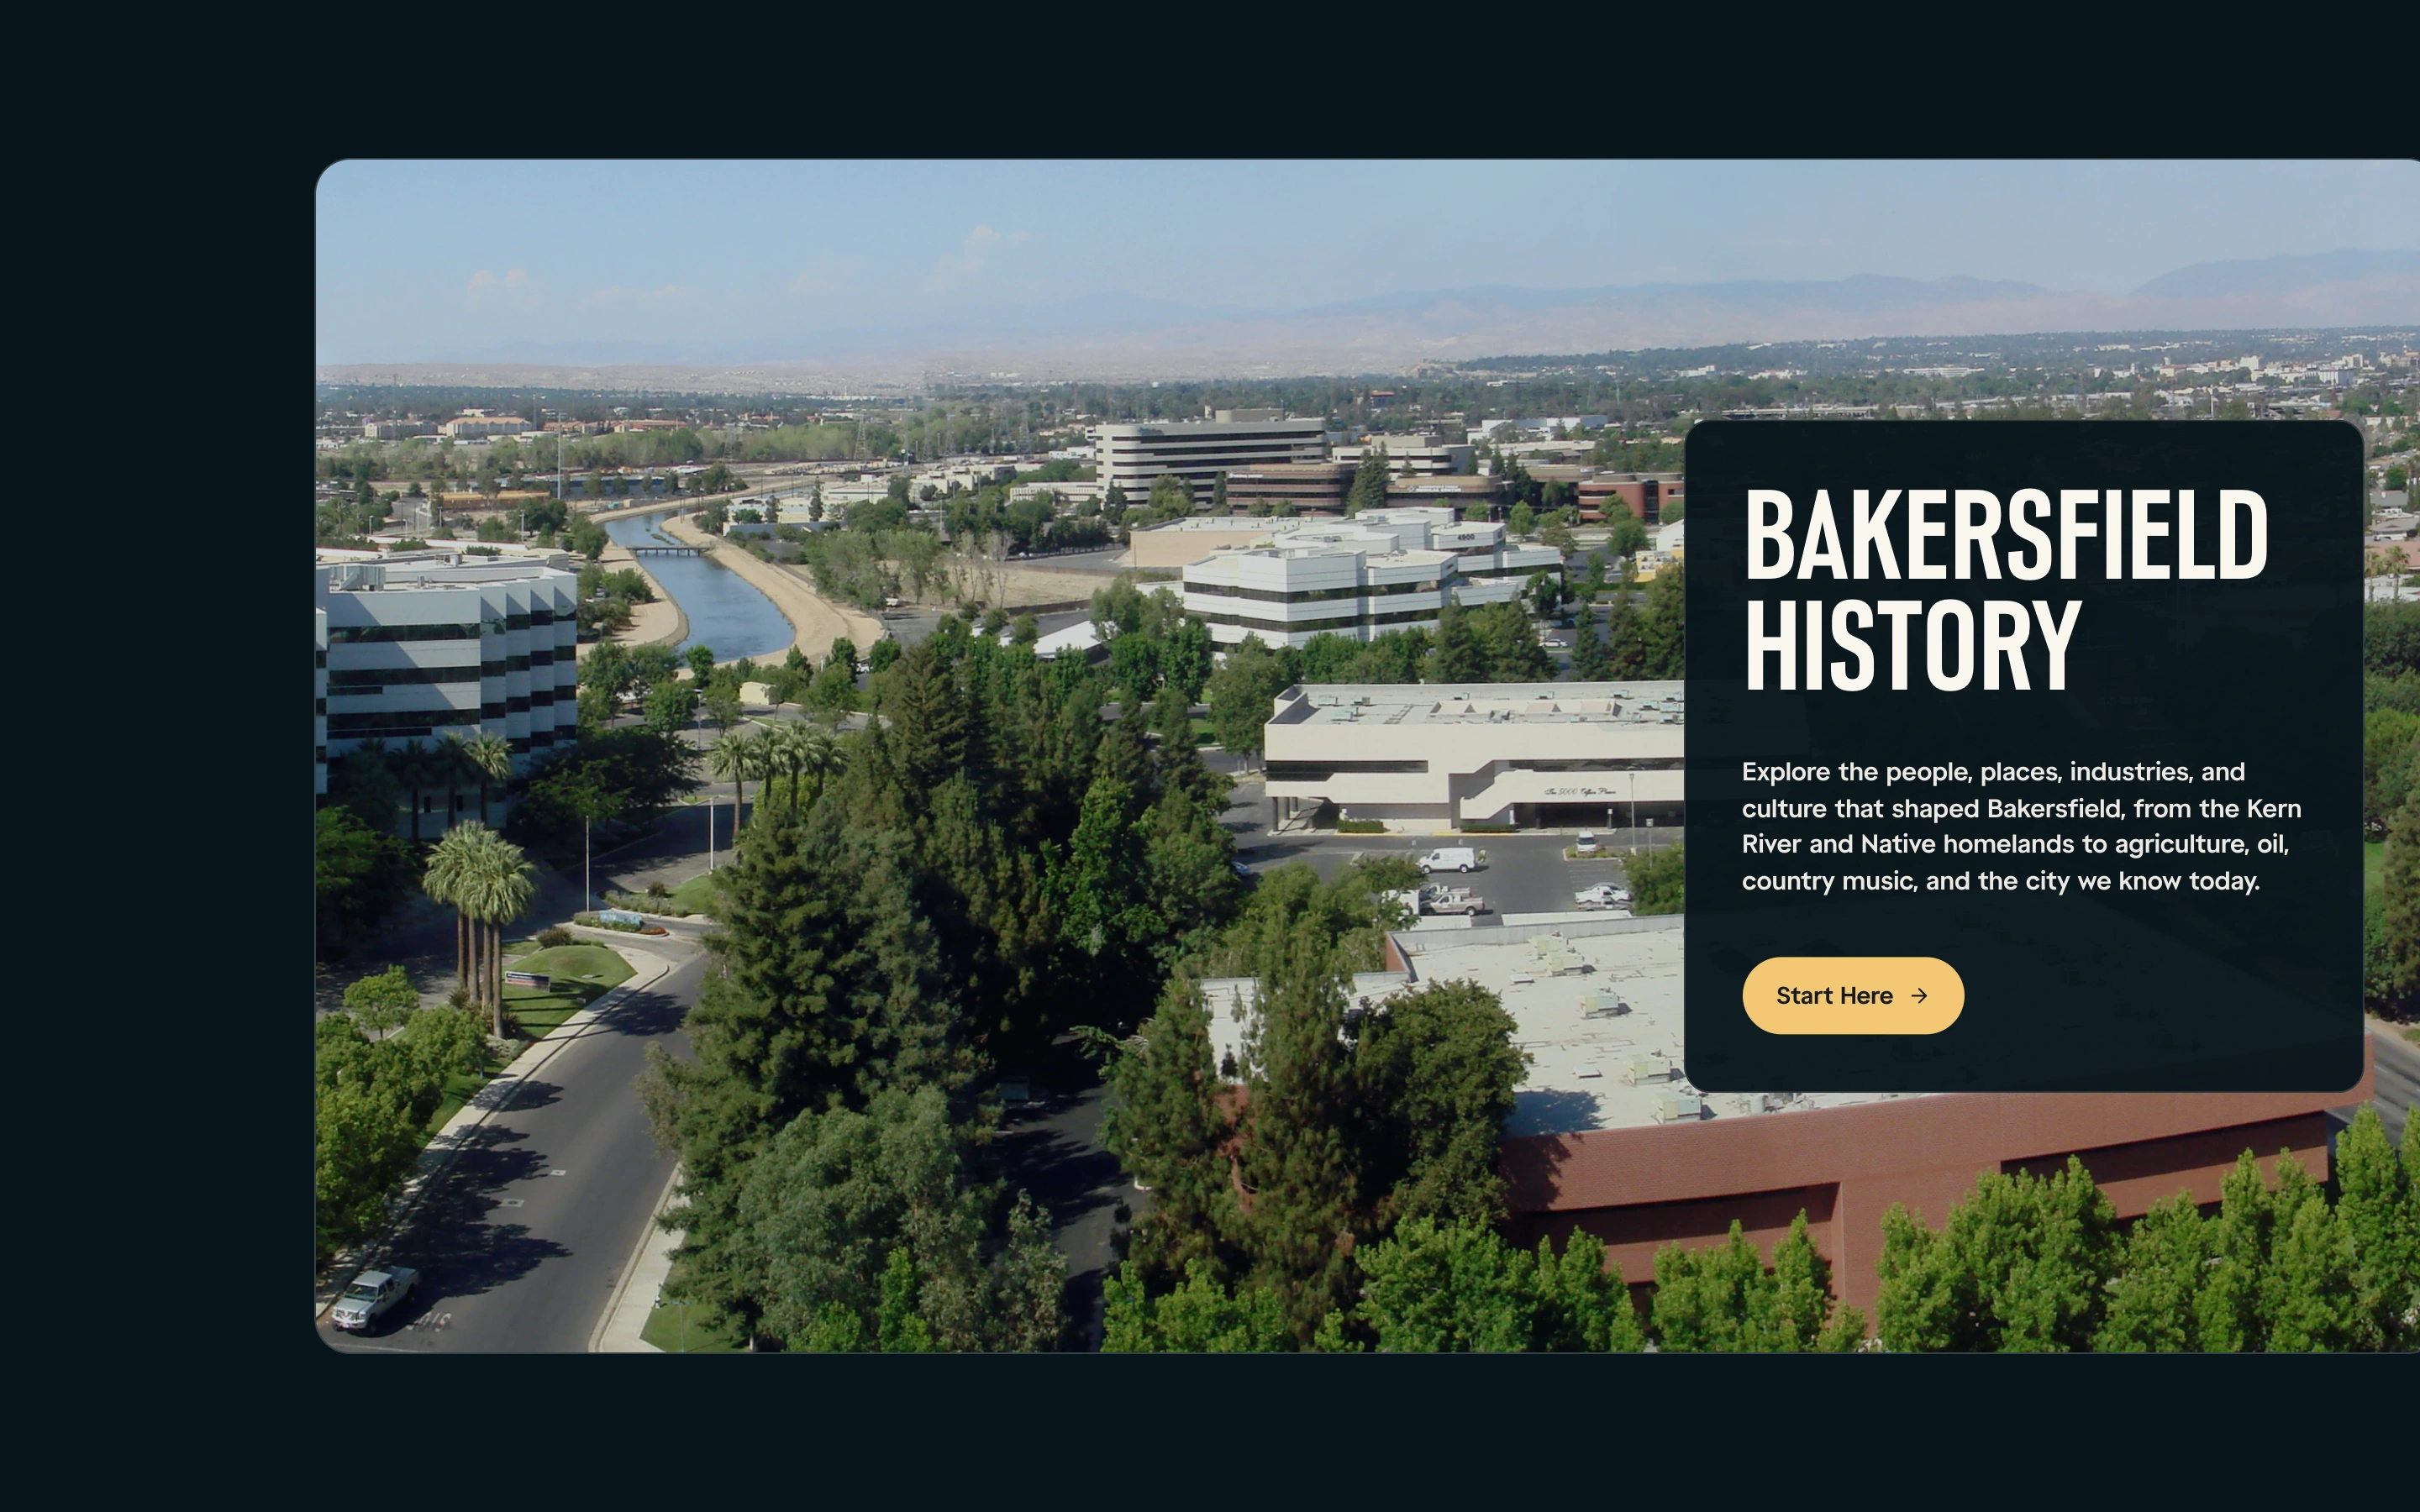
The story, scene by scene
Start with the river.
Then move forward.
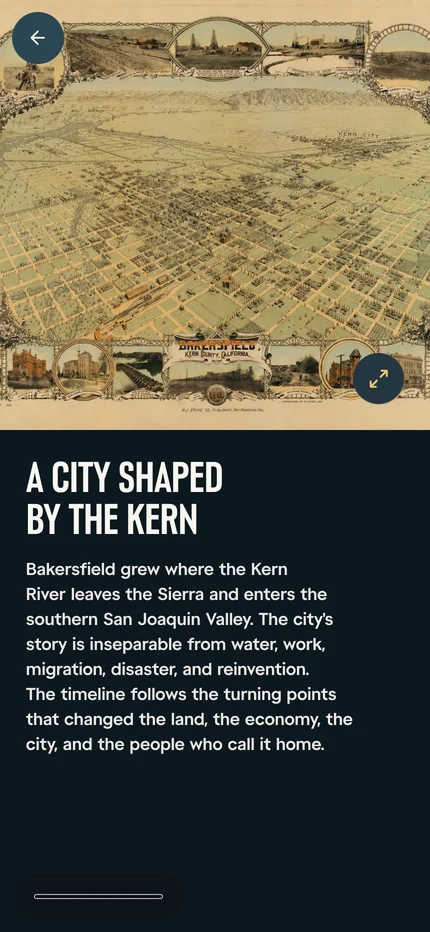
The first scene sets the place before any dates: a 1901 bird's-eye map of Bakersfield and a short note on how the city grew where the Kern River leaves the Sierra. Fifteen more scenes follow in order, through settlement, rail, farming, oil, migration, the 1952 earthquakes, the Bakersfield Sound, and growth.
Static proof from the working prototype
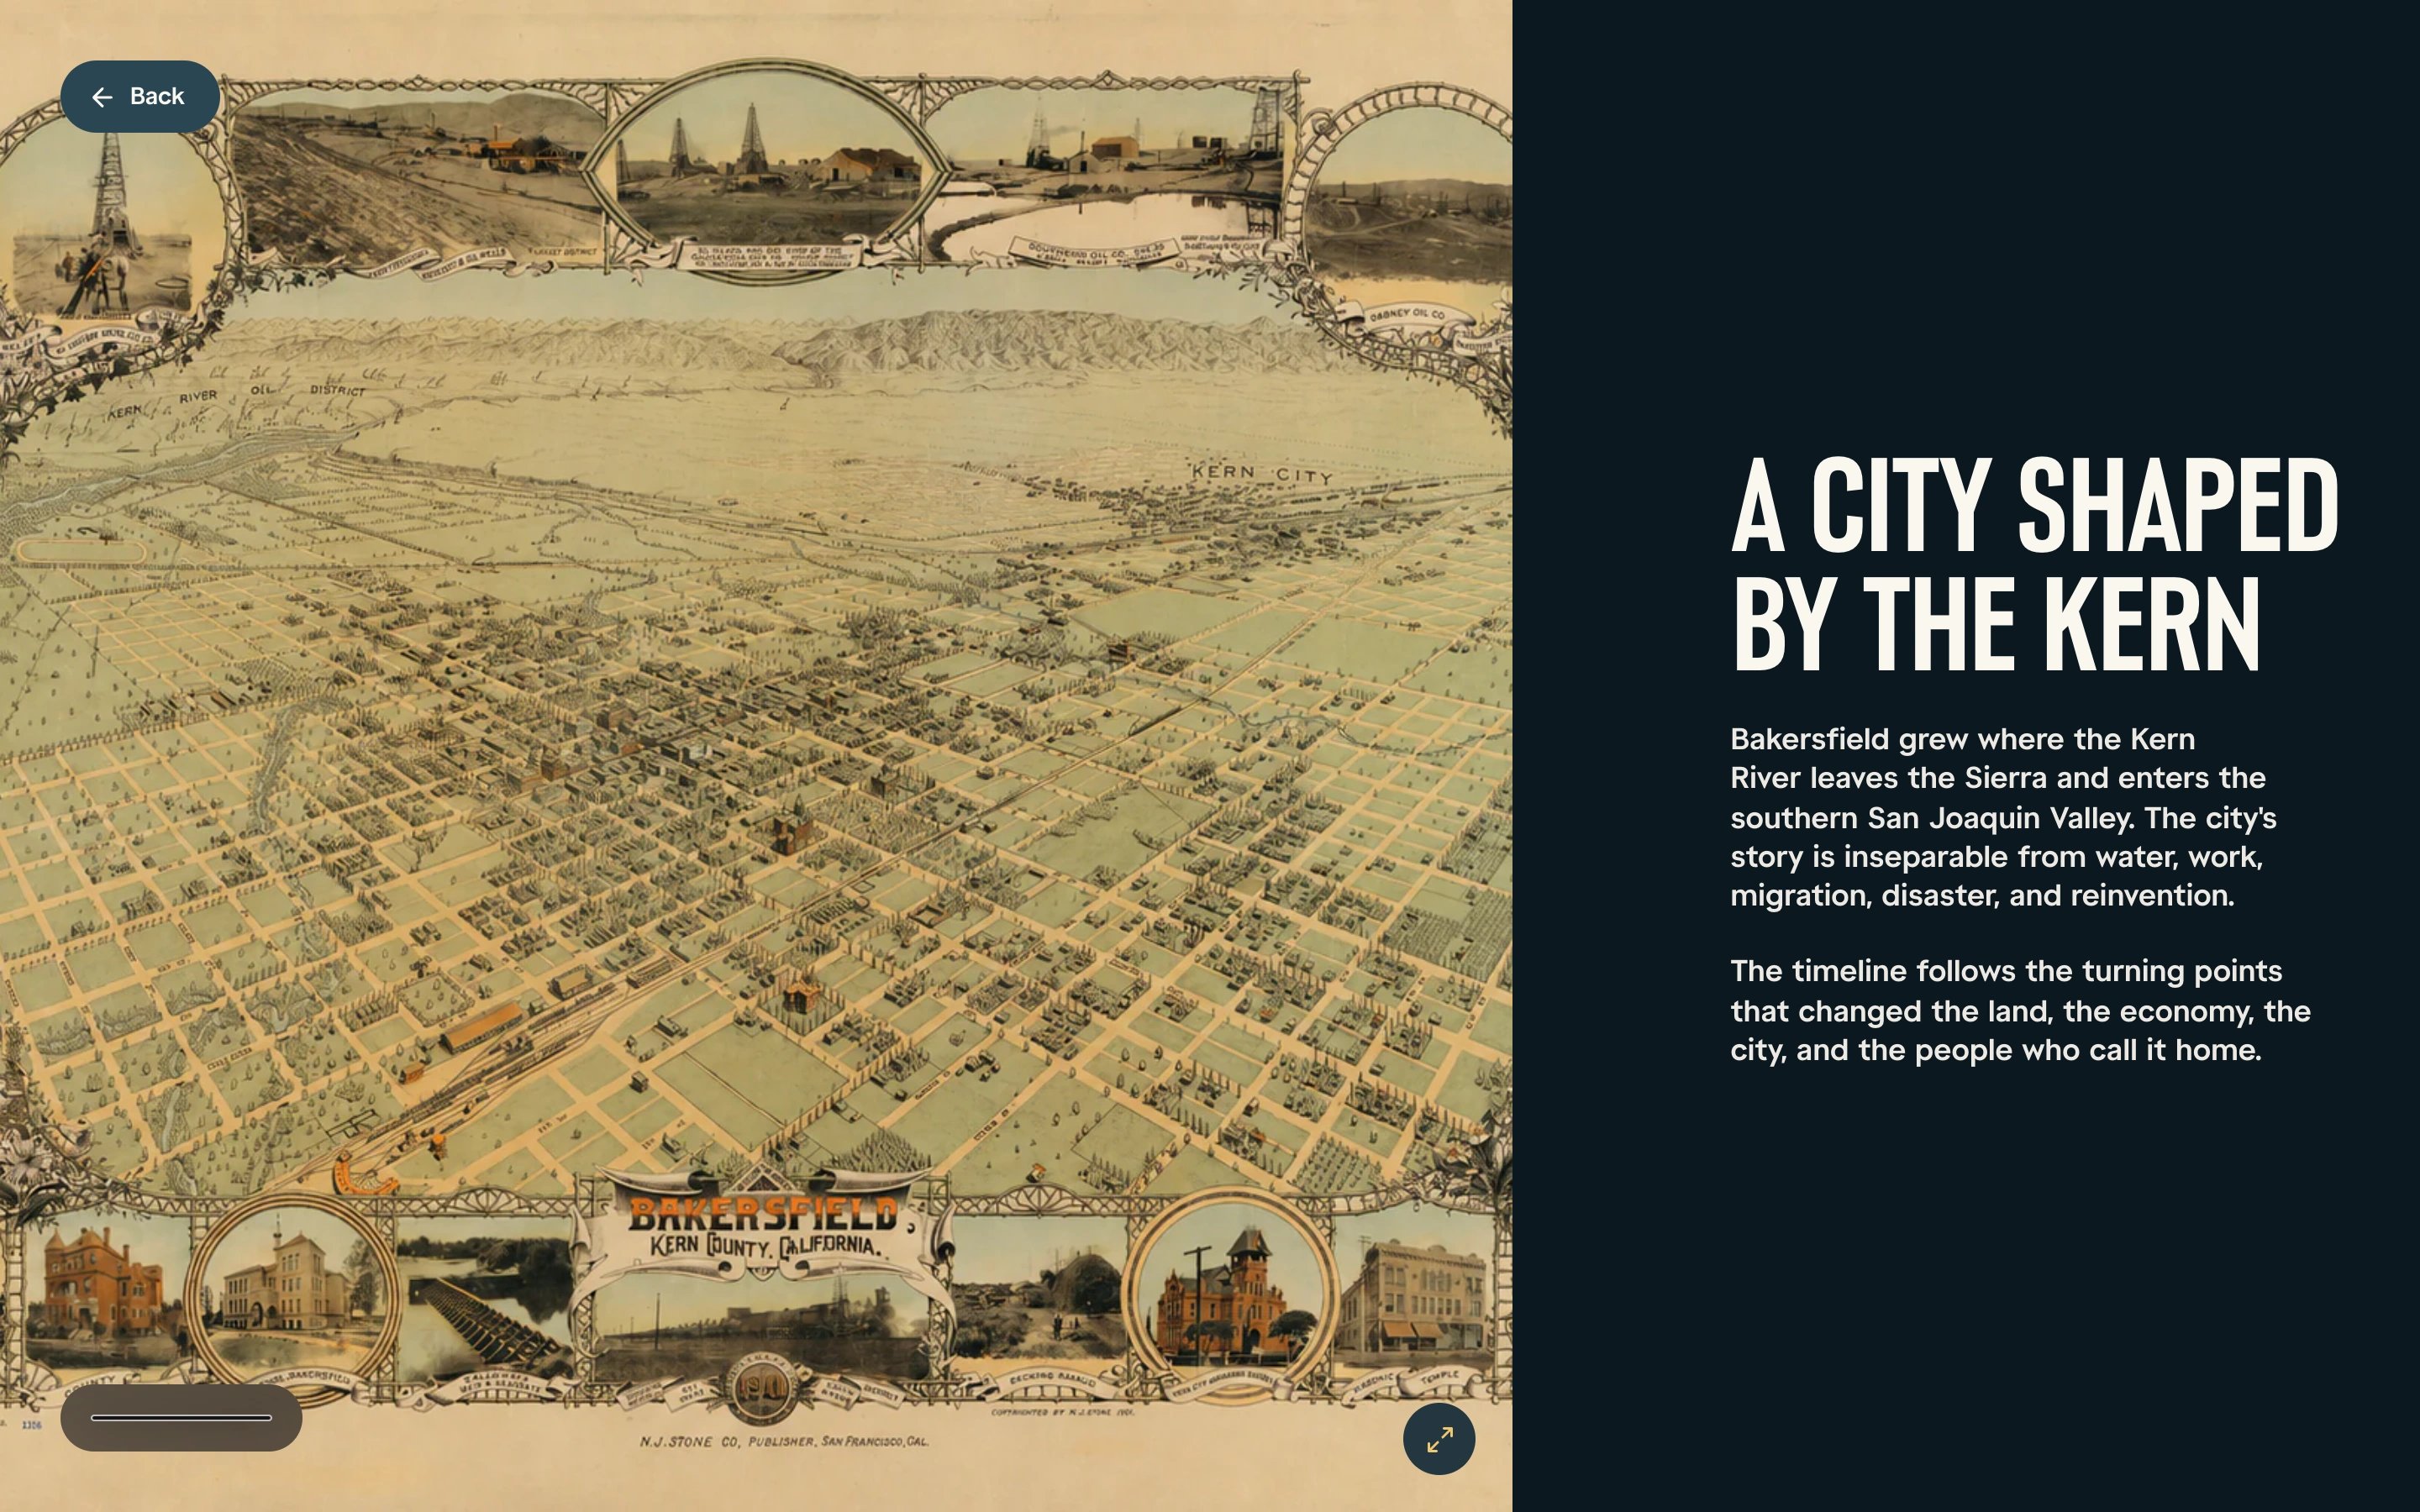
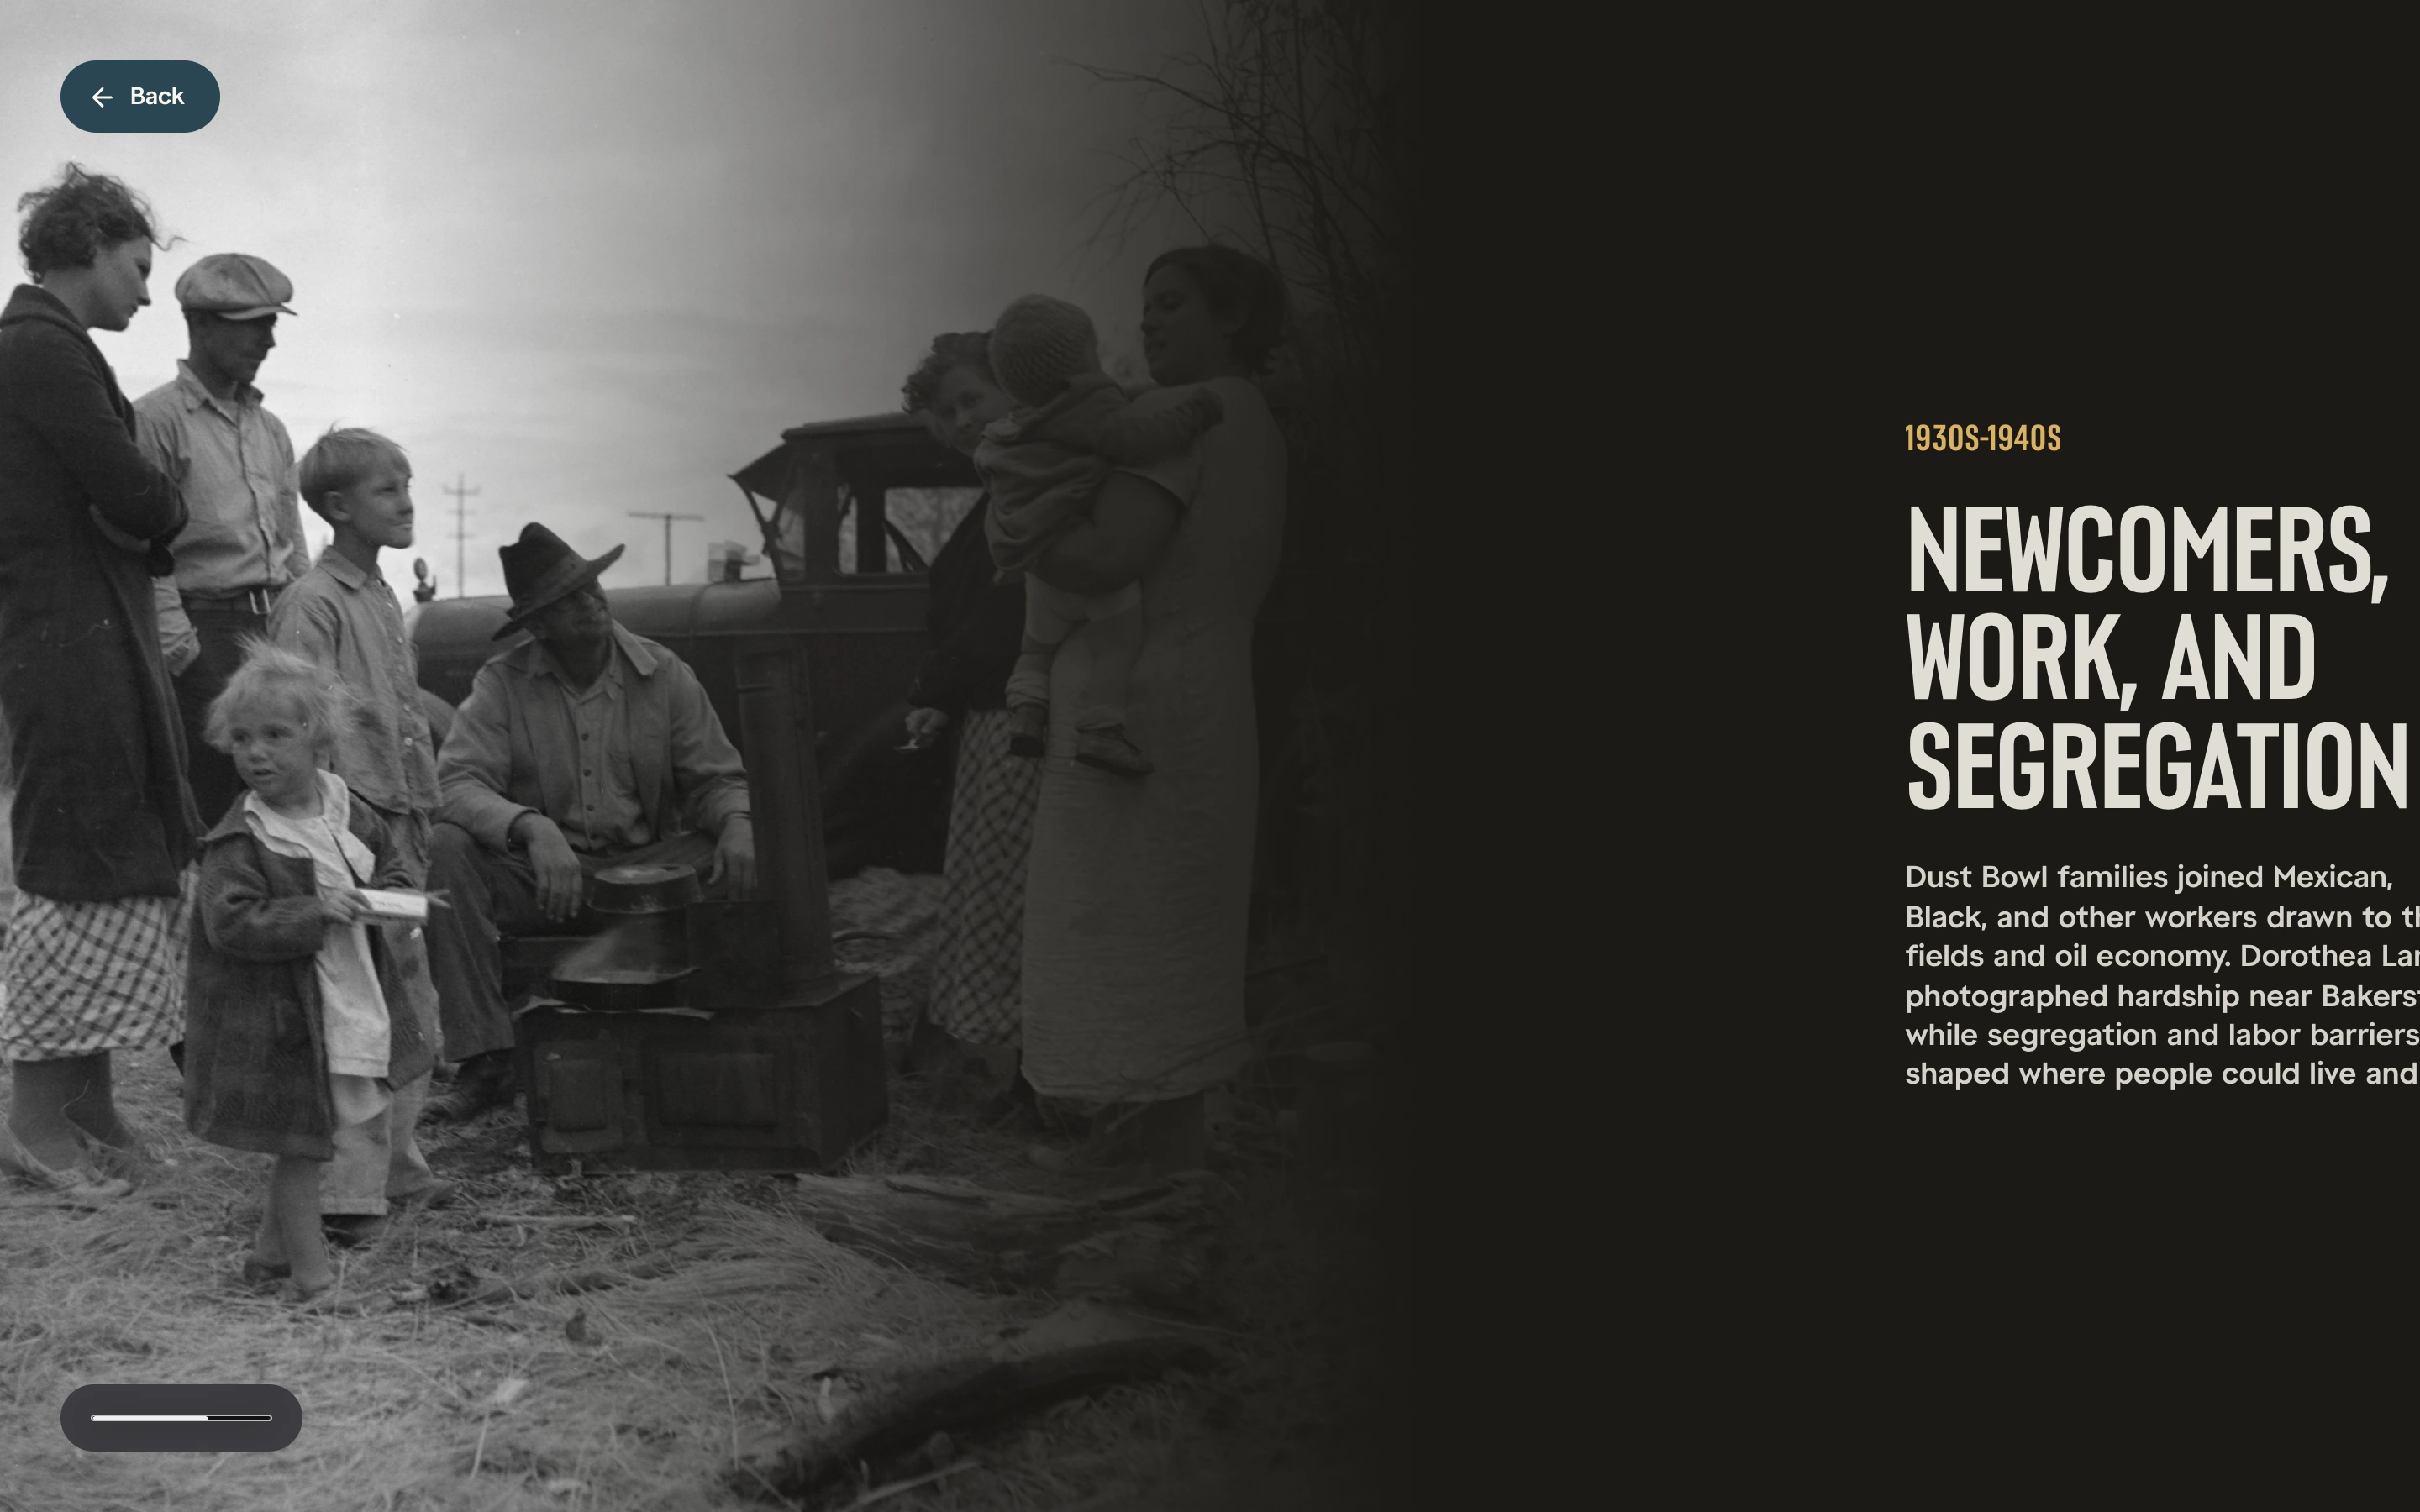
Why it is static The prototype is not published, so it is shown here as captured screens instead of an embedded preview.
What we did not build The side-scrolling viewer, its motion, and its image controls come from an existing third-party page that the prototype loads at runtime. Our work is the history inside it and the system that manages that history.
The challenge
A long history, told in short scenes.
Bakersfield's story runs from Yokuts and Tübatulabal homelands through mining, rail, irrigation, oil, Dust Bowl migration, segregation, two earthquakes, and a music scene heard worldwide. A list of dates could hold the facts but would make every era look the same.
Each scene had to say one idea in a few sentences, carry the right photographs, and keep its dates and credits straight.
The content system
Every word, date,
and photo in one file.
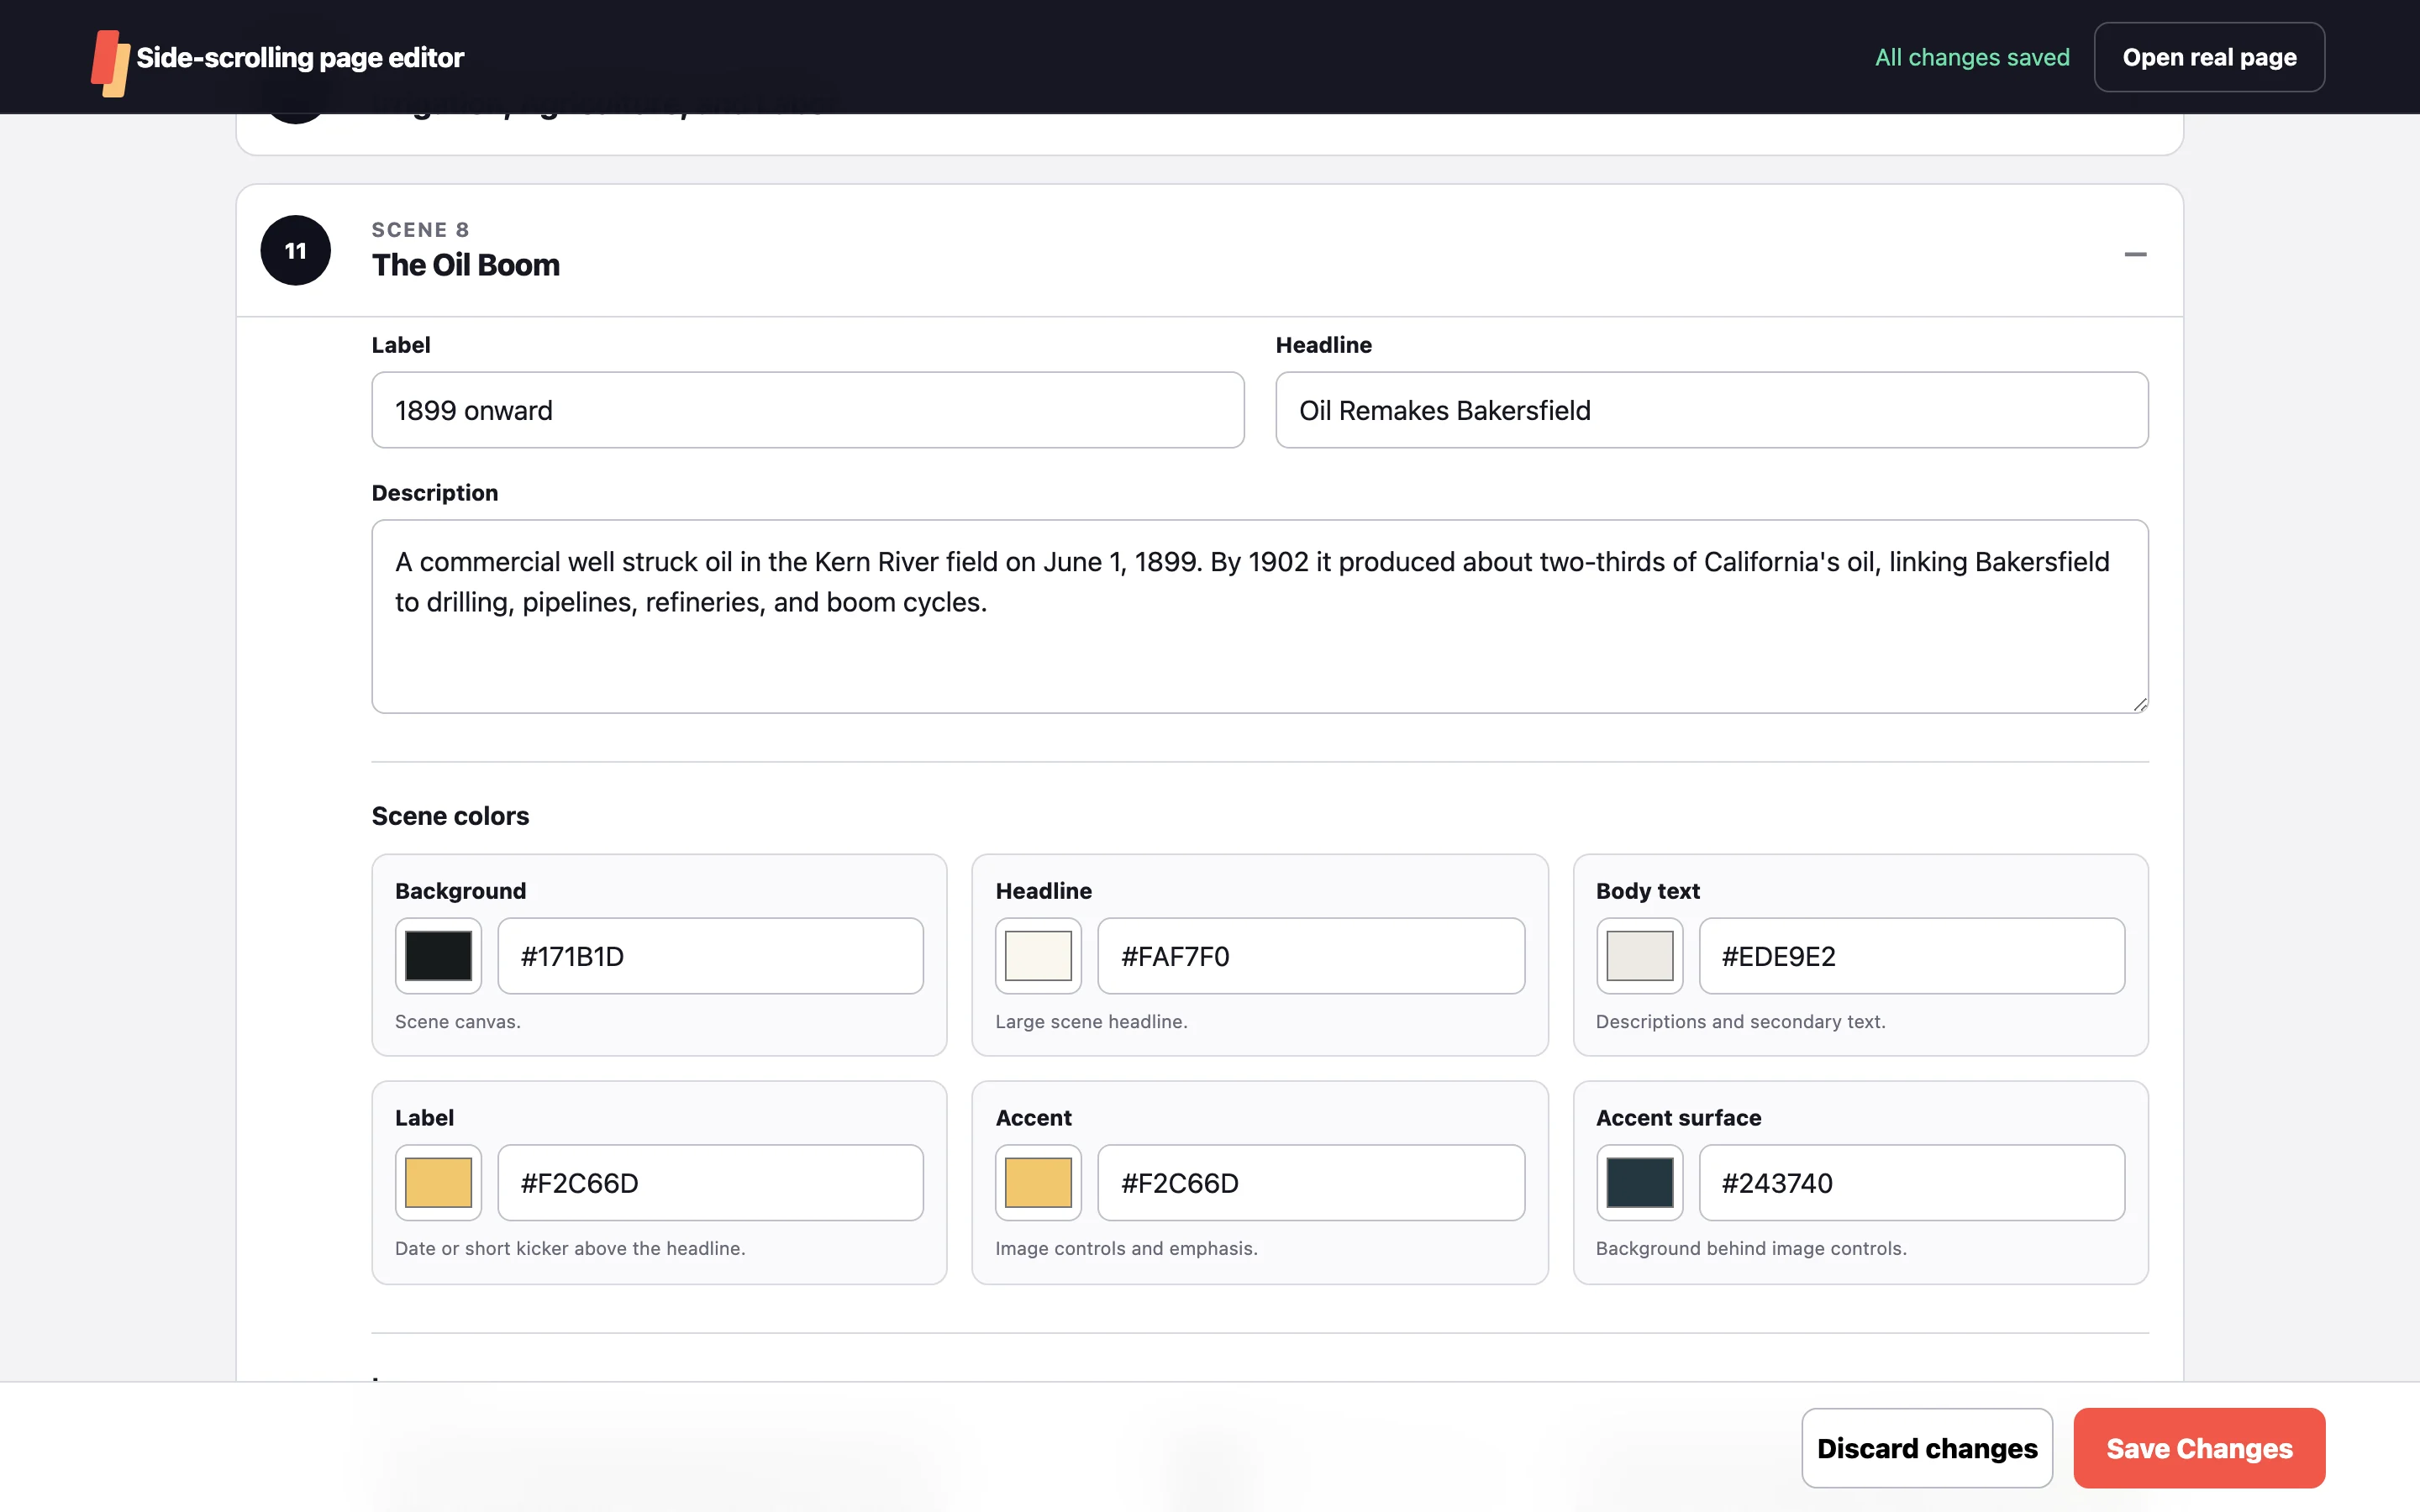
The opening card, navigation, palette, and all 16 scenes live in one content file instead of in page code. We built a local editor on top of it that lists the scenes in the same order a reader sees them, so a change to a headline, a date, a color, or a photograph is made in one place.
The editor runs only on a local machine. The production build removes it.
Art direction
The archive, ready
for a large screen.
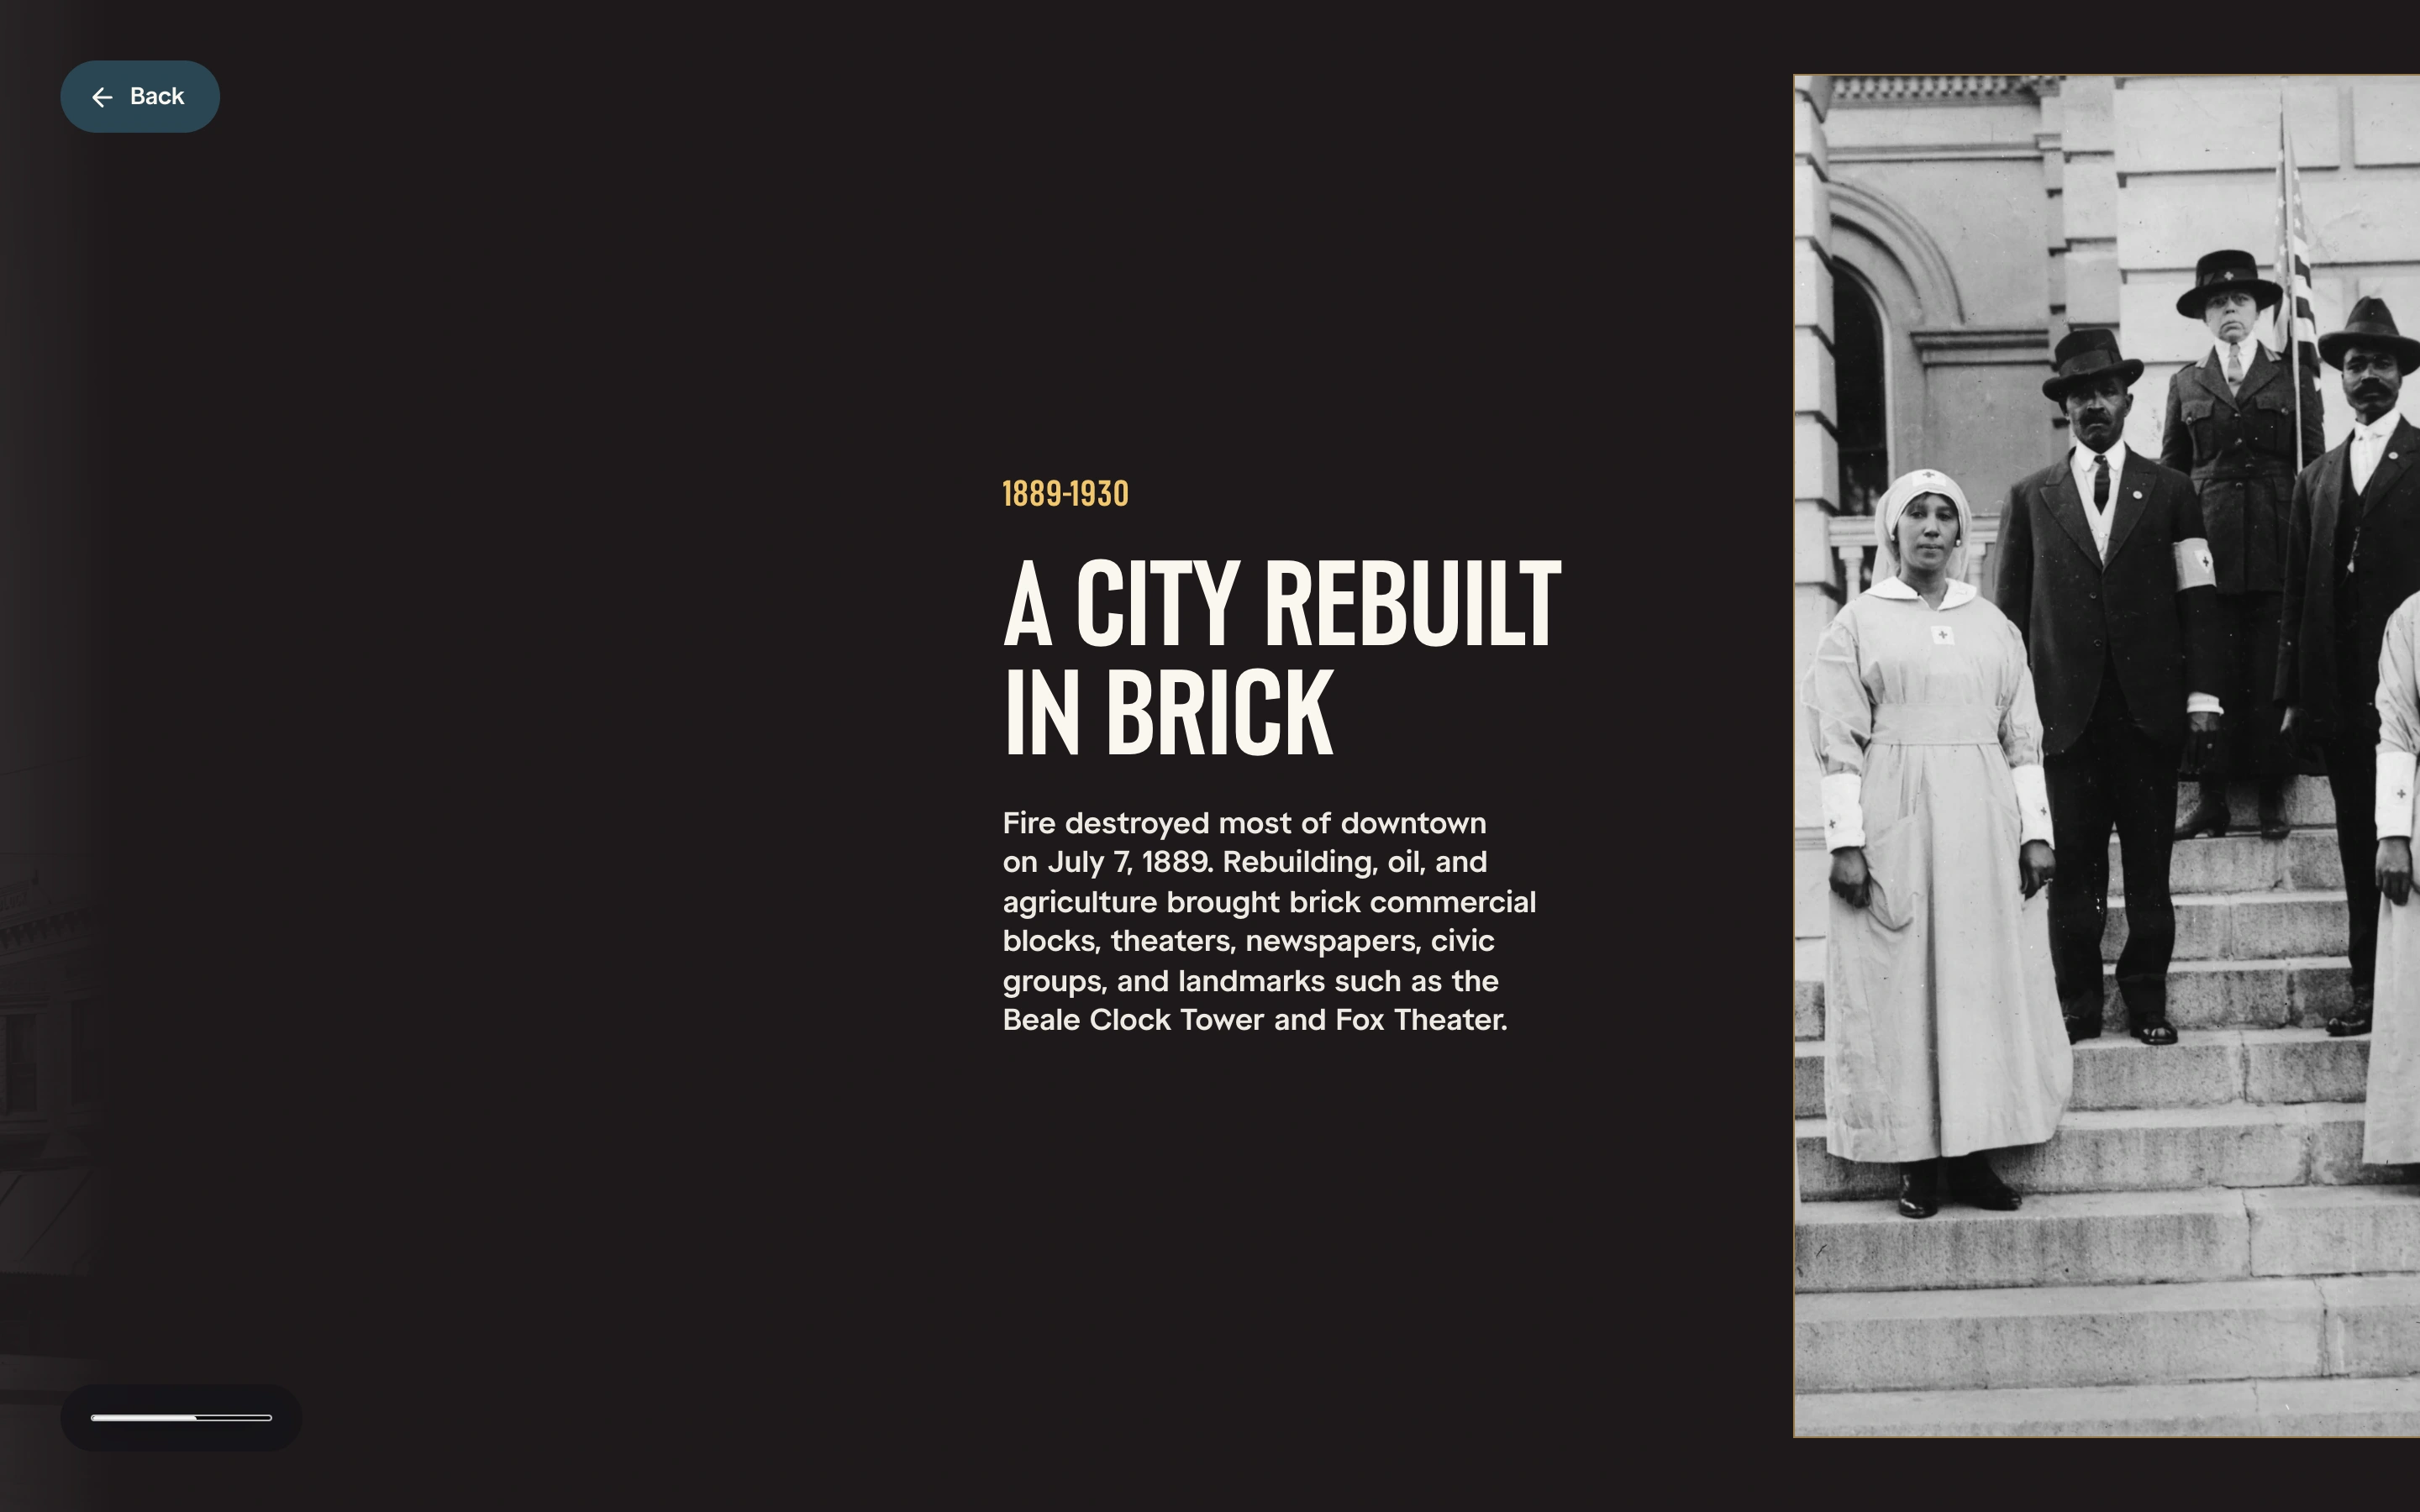
We selected the photographs and maps for every scene and prepared one optimized production image for each, 53 in all, from full-resolution masters kept outside the website. Damaged scans were restored conservatively, and each restoration is recorded with its source scan and the instructions used.
Source, credit, and rights notes are kept for every displayed image.
Text and photo, one field.
The same story, stacked.

What we made
A history you
can keep editing.
Research and writing
A complete research file on Bakersfield's history, distilled into 16 scenes with dates, headlines, and short descriptions.
Art direction
Photographs and maps chosen for each scene, with a color palette set scene by scene.
Content file and local editor
All copy, colors, and images in one file, edited in scroll order and left out of the production build.
Archival image pipeline
One optimized image per photograph from full-resolution masters, with documented restorations and image credits.
Not an archive of the city.
A way to move through its history.

Project lead
Brendan Collins
Brendan led the research, writing, content architecture, art direction, and the editor and image pipeline for Bakersfield History.
The main judgment was editorial: what each era could say in a few sentences and one or two photographs, and which images were reliable enough to carry it.
Meet the studioYour next chapter
Have a long story to tell?
We can turn a large body of history or research into scenes people will read, and a system your team can keep up to date.
Start a project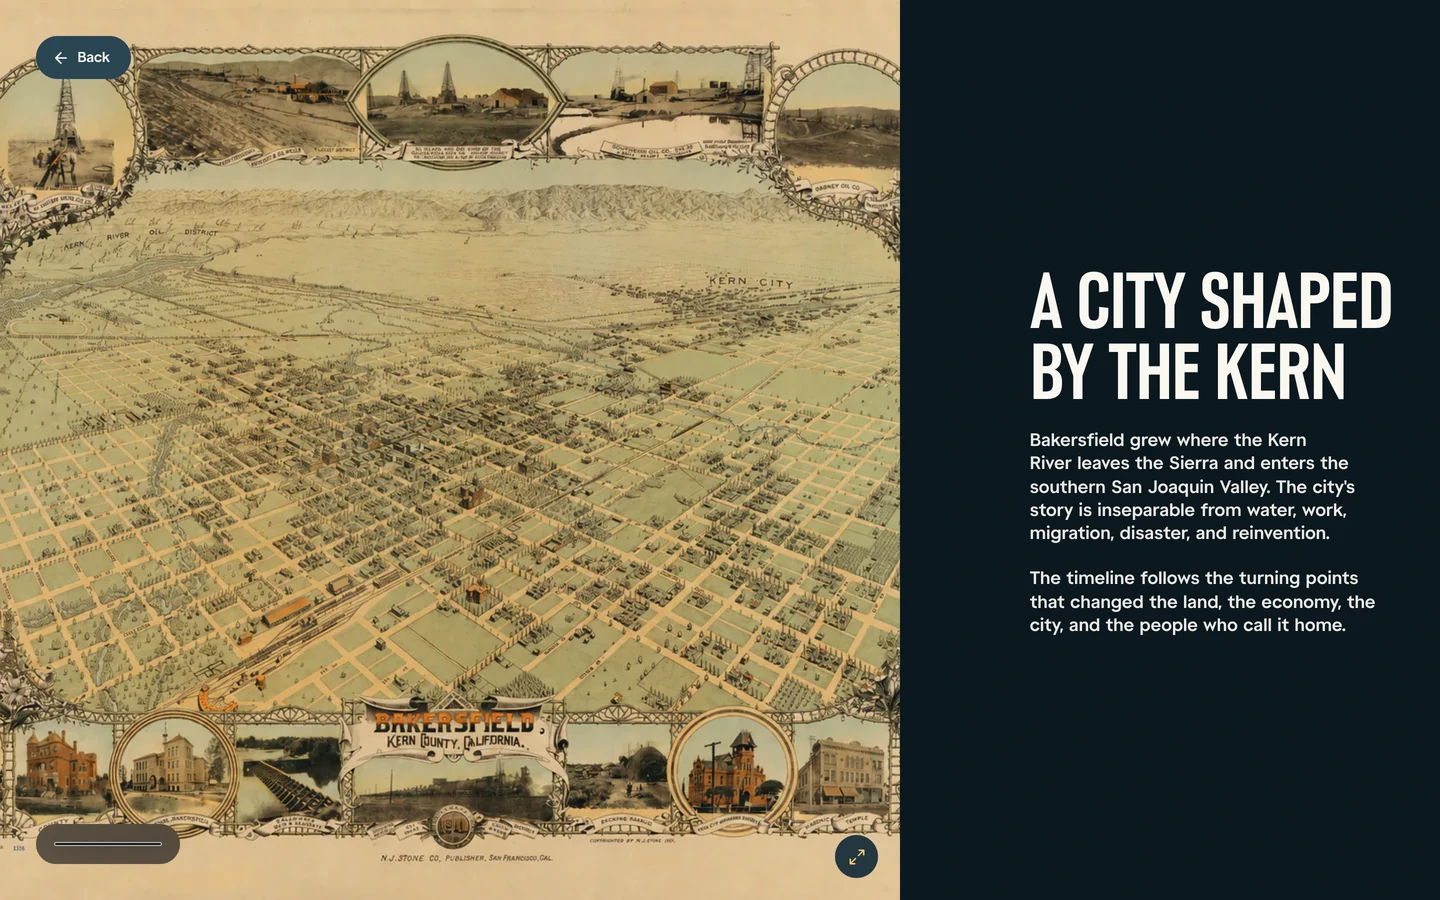
More Collins Creative work